
 Facebook
 X
X
 Pinterest
 Copy Link
REALTORS® Association of Grey Bruce Owen Sound MLS® home sales reach plateau as new supply continues to rise.
The number of homes sold through the MLS® System of the REALTORS® Association of Grey Bruce Owen Sound totaled 276 units in May 2024. This was a moderate decrease of 8.6% from May 2023.
Home sales were 4% below the five year average and 16.1% below the 10-year average for the month of May. The average price of homes sold in May 2024 was $659,827, a modest gain of 2% from May 2023.
On a year-to-date basis, home sales totaled 980 units over the first five months of the year. This decreased by 4.9% from the same period in 2023.
The MLS® Home Price Index (HPI) tracks price trends far more accurately than is possible using average or median price measures. The overall MLS® HPI composite benchmark price was $570,900 in May 2024, up modestly by 1.9% compared to May 2023.
The benchmark price for single family homes was $580,500, a minor increase of 2.1% on a year over-year basis in May. By comparison, the benchmark price for townhouse/row units was $457,800, a slight reduction of 0.5% compared to a year earlier, while the benchmark apartment price was $360,200, edging down 0.4% from year-ago levels.
The more comprehensive year-to-date average price was $647,872, up modestly by 2.5% from the first five months of 2023.
The dollar value of all home sales in May 2024 was $182.1 million, a decrease of 6.8% from the same month in 2023.
The number of new listings saw a sizable gain of 16.5% from May 2023. There were 685 new residential listings in May 2024. This was the largest number of new listings added in the month of May in more than five years.
New listings were 24.9% above the five-year average and 15% above the 10- year average for the month of May.
Active residential listings numbered 1,510 units on the market at the end of May, a substantial gain of 35.8% from the end of May 2023. Active listings haven’t been this high in the month of May in more than five years.
Active listings were 59.4% above the five-year average and 23.7% above the 10- year average for the month of May.
Months of inventory numbered 5.5 at the end of May 2024, up from the 3.7 months recorded at the end of May 2023 and above the long-run average of 3.8 months for this time of year. The number of months of inventory is the number of months it would take to sell current inventories at the current rate of sales activity.
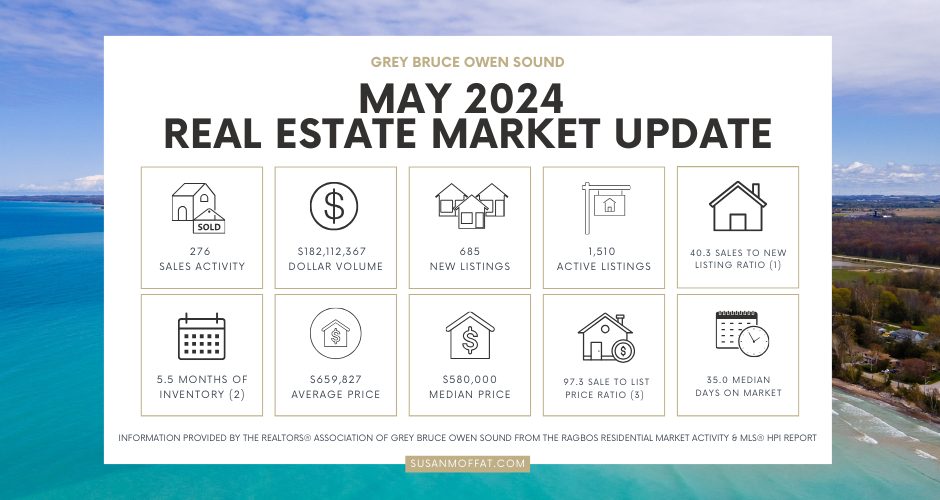
(1) Sales / new listings * 100; compared to levels from previous periods. (2) Active listings at month end / monthly sales; compared to levels from previous periods. (3) Sale price / list price * 100; average for all homes sold in the current month.
Find more information and statistics at ragbos.com
Wondering how these numbers might impact your real estate plans? Whether you’re buying, selling, or just curious about market trends, I’ve got you covered! Let’s navigate the market together! Call today for a complimentary property valuation.
For more information, contact:
Susan Moffat, REALTOR® with Century 21 In-Studio Realty Inc., Brokerage
519.377.5154
susan.moffat@c21.ca
")
